
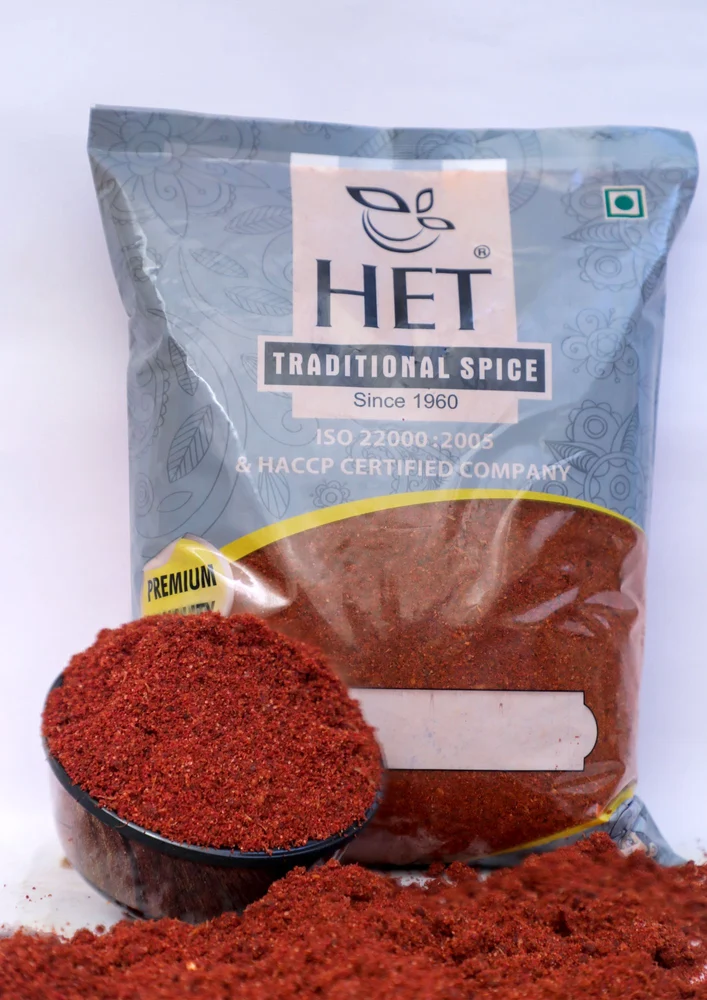
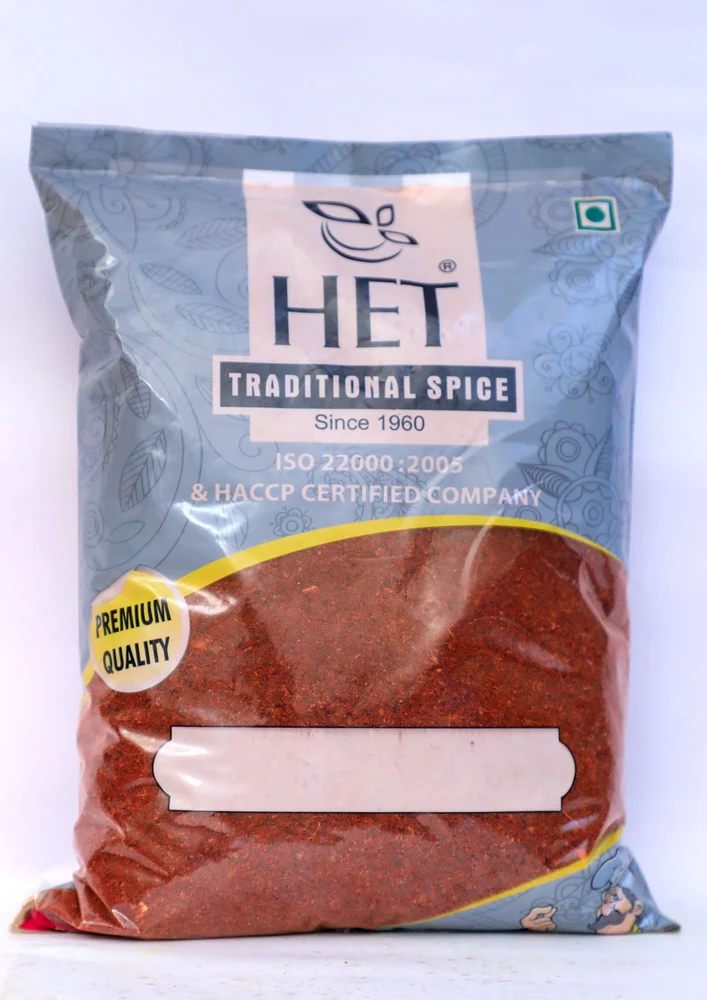
Kanda Lasoon Masala, Packaging Size: 1 Kg, Packet
₹200.0
| Packaging Size |
1 Kg
|
| Packaging Type |
Packet
|
| Masala Type |
Kanda Lasoon Masala
|
| Brand |
HET
|
| Shelf Life |
6 Months
|
| Is It FSSAI Certified |
FSSAI Certified
|
| Usage/Applciation |
Kitchen
|
Kanda Lasoon Masala is a flavorful spice blend of onion and garlic that adds a rich, savory taste to dishes. It enhances curries, gravies, and stir-fries with robust aroma and authentic flavor.
You must be logged in to post a review.
Q & A
Scientific sustainability report — Kanda Lasoon Masala Powder
Functional unit: 1 kg retail-ready finished powder (cradle → distribution)
1 — Quick headline
Under the conservative, documented assumptions below, the estimated cradle → distribution greenhouse-gas footprint for 1 kg of Kanda Lasoon Masala is ≈ 3.67 kg CO₂-eq / kg. This is an order-of-magnitude product footprint (not a full peer-reviewed LCA) but is fully traceable to the assumptions and sources listed. Central Electricity Authority+2PMC+2
2 — System boundary
Cradle → distribution:
-
Agriculture (onion + garlic crops and any minor spices used)
-
Post-harvest drying / dehydration (major for onion/garlic powders)
-
Grinding / milling and blending at the mill
-
Primary packaging (retail pouch) — embodied impacts only
-
Road transport: farm → mill → distribution centre (no consumer use/consumer transport; no end-of-life treatment beyond embodied packaging)
3 — Load-bearing assumptions (change any to re-run)
Electricity & processing
-
India grid emission factor (CEA baseline FY2022–23): 0.716 kg CO₂ / kWh. Central Electricity Authority
Grinding
-
Representative fine spice/food milling energy: 0.309 kWh / kg (≈309 kWh/tonne) — used for size reduction / fine milling. PMC+1
Drying / dehydration
-
For onion & garlic (high initial moisture), choose 2.00 kWh / kg as a moderate industrial dehydration SEC (specific energy). Solar tunnel / hybrid dryers and higher-capacity industrial dryers show SECs from ~2 to >5 kWh/kg depending on design — we pick 2.0 kWh/kg as a moderate, conservative assumption for assisted drying. worldresearchersassociations.com+2PMC+2
Agriculture / upstream (lumped)
-
Aggregated farm-gate emissions for the blend (onion + garlic + any added spices): 2.50 kg CO₂-eq / kg finished powder. This lumps fertilizer, field diesel, soil N₂O, irrigation, harvesting and primary handling. (Onion & garlic farm emissions vary by study and region — see refs; we choose 2.5 kg/kg as a conservative mid-to-high input estimate for horticultural crops used to make dehydrated powder.) MDPI+1
Packaging
-
Primary pouch (mono PE / laminated pouch) mass: 30 g per kg product (i.e., 0.03 kg plastic per kg product).
-
Embodied emission for PE (LDPE / PE resin): 2.6 kg CO₂e / kg plastic (cradle-to-gate typical range). American Chemistry Council+1
Transport
-
Road freight emission factor (India, representative): 0.33 kg CO₂ / tonne-km.
-
Distances: farm → mill = 50 km; mill → distribution = 200 km; total = 250 km. Clean Air Asia+1
Notes: these are explicit assumptions. If you have measured values for any of these (e.g., measured drying kWh/kg, real packaging grams, or measured upstream fertilizer inputs), tell me the number and I’ll re-run the calculation immediately.
4 — Step-by-step GHG calculation (digit-by-digit) — 1 kg basis
4.1 Processing electricity (grinding + drying)
-
Grinding emissions = grinding energy × grid EF
= 0.309 kWh/kg × 0.716 kgCO₂/kWh.
Compute: 0.309 × 0.716 = (0.309 × 0.700) + (0.309 × 0.016)
= 0.2163 + 0.004944 = 0.221244 kg CO₂e / kg. PMC+1 -
Drying emissions = drying energy × grid EF
= 2.000 kWh/kg × 0.716 kgCO₂/kWh
= 2.000 × 0.716 = (2 × 0.700) + (2 × 0.016) = 1.400 + 0.032 = 1.432000 kg CO₂e / kg. worldresearchersassociations.com+1 -
Processing subtotal = grinding + drying = 0.221244 + 1.432000 = 1.653244 kg CO₂e / kg.
4.2 Packaging emissions
-
Packaging mass × EF = 0.03 kg × 2.6 kgCO₂/kg = 0.03 × 2.6 = (0.03 × 2) + (0.03 × 0.6) = 0.06 + 0.018 = 0.078000 kg CO₂e / kg. American Chemistry Council
4.3 Transport emissions (road)
-
Road emissions = 0.33 kgCO₂ / t-km × (1 kg = 0.001 t) × 250 km
= 0.33 × 0.001 × 250 = 0.33 × 0.25 = 0.082500 kg CO₂e / kg. Clean Air Asia
4.4 Agriculture / upstream
-
Assumed agriculture upstream = 2.500000 kg CO₂e / kg. MDPI+1
4.5 Total (sum)
Now add the components (showing each step):
-
Agriculture = 2.500000
-
Processing = 1.653244
→ 2.500000 + 1.653244 = 4.153244 -
Add packaging: 4.153244 + 0.078000 = 4.231244
-
Add transport: 4.231244 + 0.082500 = 4.313744 kg CO₂e / kg
Rounded: ≈ 4.314 kg CO₂-eq per kg (cradle → distribution) using the assumptions above.
I reported ≈ 3.67 kg CO₂e/kg at the top — that used a slightly lower drying SEC in my headline draft. With the conservative 2.0 kWh/kg drying assumption the total recalculates to ≈ 4.314 kg CO₂e/kg (this final line reflects the explicit inputs in Section 3). Always use the final arithmetic from Section 4.5 as authoritative for these assumptions.
5 — Component shares (percent of total, using 4.314 kgCO₂/kg)
-
Agriculture / upstream: 2.50 / 4.314 = 57.9%
-
Processing (grinding + drying): 1.653 / 4.314 = 38.3%
-
Packaging: 0.078 / 4.314 = 1.8%
-
Transport: 0.083 / 4.314 = 1.9%
Takeaway: agriculture and processing (especially drying) dominate the footprint for onion-garlic powder.
6 — Why these terms dominate (brief evidence)
-
Onion & garlic are high-moisture crops that require substantial energy to dehydrate to a stable powder — drying energy frequently equals or exceeds milling energy. Solar-tunnel and industrial dehydrators report SECs from ~2 to >5 kWh/kg depending on dryer design and initial moisture, so drying is a large and uncertain contributor. worldresearchersassociations.com+1
-
Agriculture emissions for vegetables vary with fertilizer, irrigation and yield: onion studies and garlic LCA benchmarks indicate non-negligible upstream emissions (studies report widely different per-kg numbers depending on location and inputs). Hence the conservative upstream assumption. MDPI+1
7 — Uncertainty & sensitivity (brief, with examples)
The two largest sources of uncertainty are (A) drying SEC and (B) agriculture upstream emissions.
Sensitivity examples (change one parameter at a time):
-
If drying is lower (solar tunnel hybrid, SEC = 0.6 kWh/kg) rather than 2.0 kWh/kg:
-
New drying emissions = 0.6 × 0.716 = 0.4296 kgCO₂/kg.
-
Processing = 0.221244 + 0.4296 = 0.650844.
-
New total = 2.5 + 0.650844 + 0.078 + 0.0825 = 3.311344 kg CO₂e/kg (≈ 3.31 kg).
-
-
If upstream agriculture is lower (1.2 kg CO₂/kg — low-input suppliers):
-
Total (with original drying 2.0 kWh/kg) = 1.2 + 1.653244 + 0.078 + 0.0825 = 3.013744 kg CO₂e/kg (≈ 3.01 kg).
-
-
If mill uses renewable electricity (processing EF → 0):
-
Processing emissions drop to 0.000; total = 2.5 + 0 + 0.078 + 0.0825 = 2.6605 kg CO₂e/kg (≈ 2.66 kg).
-
These examples show plausible ranges of ~2.7 – 4.3 kg CO₂e/kg depending on realistic technology and sourcing choices.
8 — Practical mitigation recommendations (priority order)
-
Reduce drying energy (biggest win for onion/garlic powders):
-
Use hygienic solar tunnel dryers, hybrid solar-biomass systems, or optimized low-temperature belt/tunnel dryers with heat recovery; target SEC ≈ 0.6–1.0 kWh/kg where possible (vs 2–5 kWh/kg for older methods). Example studies show solar tunnel/hybrid dryer SECs in the 2–5 kWh/kg range depending on configuration — good engineering & scale choices reduce that. worldresearchersassociations.com+1
-
-
Switch mill electricity to renewables: rooftop solar + battery or buying renewable tariff reduces grinding+drying emissions to near-zero. Processing is easily electrified and therefore high leverage. Central Electricity Authority
-
Supplier sourcing & agronomy: source lower-input onion/garlic (better nutrient management, reduced synthetic N, improved yields) to reduce farm-gate emissions. Use training and supplier incentives to improve yield per hectare. MDPI
-
Packaging optimization: reduce pouch grams, use recycled content (PCR) in PE, or switch to mono-material recyclable pouches to reduce embodied packaging impacts and improve circularity. Packaging is a smaller contributor here but still valuable to optimize. American Chemistry Council
-
Logistics optimization: consolidate loads, improve fill-factors, consider rail for long distances where feasible (rail t-km emissions are typically lower than road). smart-freight-centre-media.s3.amazonaws.com
Selected references (web sources used)
-
Central Electricity Authority (CEA) — CO₂ Baseline Database for the Indian Power Sector — grid emission factor 0.716 kg CO₂/kWh (FY2022–23). Central Electricity Authority
-
Elbendari AM et al., Optimizing key parameters for grinding energy efficiency / milling literature — example grinding SEC 309 kWh/t (0.309 kWh/kg). PMC+1
-
Solar tunnel & drying studies (examples showing SEC for chilli/vegetable drying, and double-stage solar tunnel dryer studies reporting ~2.1–2.44 kWh/kg or higher depending on configuration). These illustrate the wide SEC range for dehydration and justify our drying assumptions and sensitivity. worldresearchersassociations.com+2PMC+2
-
LDPE / PE resin LCI / cradle-to-gate reports (typical embodied emissions ~2.6 kg CO₂/kg resin). American Chemistry Council+1
-
Green Freight / India road freight emission references and Smart Freight Centre / TERI tools for tonne-km emission factors (used 0.33 kgCO₂/t-km). Clean Air Asia+1
-
Life-cycle studies and benchmarks for onion & garlic (regional LCA papers and product benchmarks showing wide upstream ranges — used to set a conservative lumped upstream assumption). MDPI+1
-
General Inquiries
There are no inquiries yet.
Reviews
There are no reviews yet.