Shopping Cart
Shipping Address :
Guest
No shipping address found. Please add an address.
—
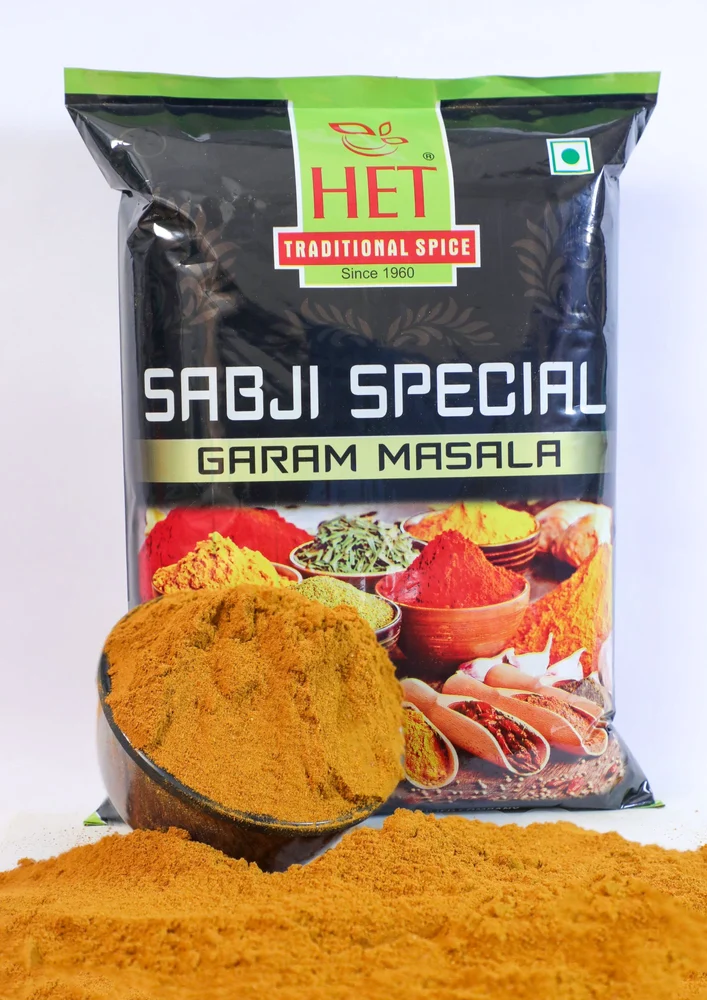
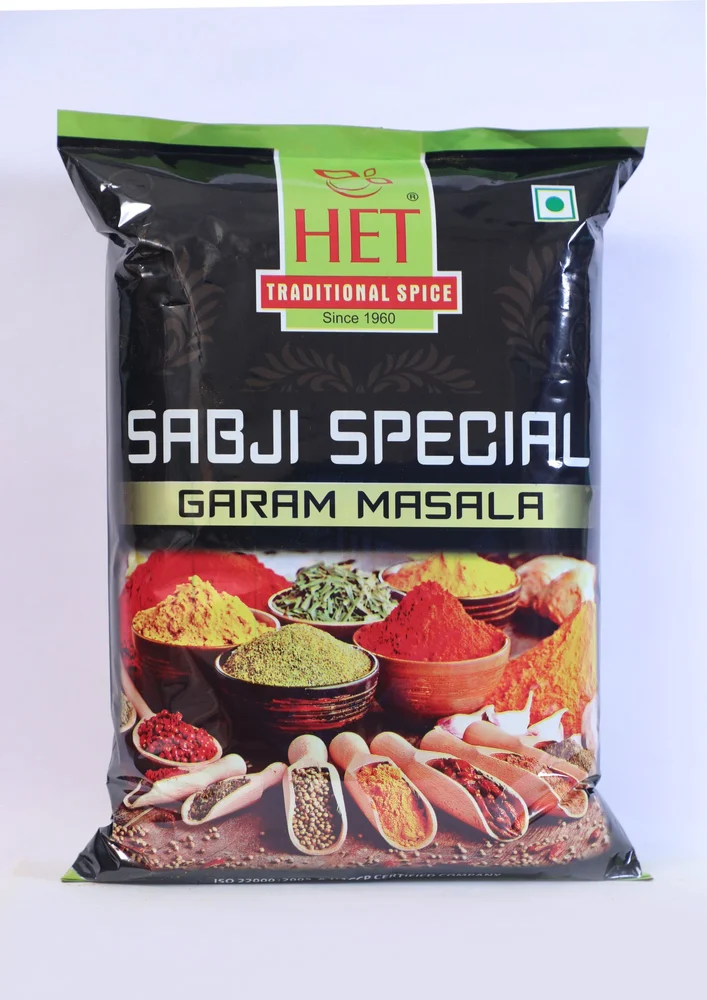
Sabji Masala Powder, Packaging Size: 500 gm
Price: ₹140.00 per pieces
Estimated Total Amount: ₹140.00


| Masala Type |
Mix Sabji Masala |
| Packaging Size |
500 gm |
| Brand |
HET |
| Packaging Type |
Packets |
| Shelf Life |
6 Months |
| Is It FSSAI Certified |
FSSAI Certified |
| Usage/Applciation |
Kitchen |
| Masala Type |
Mix Sabji Masala |
| Packaging Size |
500 gm |
| Brand |
HET |
| Packaging Type |
Packets |
| Shelf Life |
6 Months |
| Is It FSSAI Certified |
FSSAI Certified |
| Usage/Applciation |
Kitchen |
No reviews yet. Be the first to review this product.
Login to ask a question.
Using conservative, literature-based assumptions for farm production, processing (drying + grinding), packaging and road transport, the estimated cradle-to-distribution greenhouse gas (GHG) emissions for 1 kg of sabji masala powder are ≈ 3.08 kg CO₂e per kg. This is an order-of-magnitude estimate (not a full peer-reviewed LCA) but is transparent and traceable to sources and assumptions below. PMC+1
Functional unit: 1 kg of retail-ready Sabji Masala Powder.
System boundary (cradle → distribution): agriculture of raw spices → primary drying (if required) → grinding/processing → packaging (primary plastic pouch) → transport from farm to mill and mill to distribution center (road). (Does not include retail use, consumer transport, end-of-life of packaging, or emissions embedded in capital equipment.)
(References after each key parameter.)
Grid electricity emission factor India (FY 2022–23): 0.716 kg CO₂ / kWh (CEA / CO₂ Baseline Database user guide). Central Electricity Authority
Specific energy for grinding / size reduction measured in recent studies: ~309 kWh per tonne (0.309 kWh/kg) for fine milling / size reduction in food powders. PMC
Drying energy for spices / turmeric: published studies show a range (~1.2–2.5 kWh/kg for some drying methods); for a moderate industrial drying assumption we use 1.0 kWh/kg (representative, conservative moderate value from drying studies). ResearchGate+1
Plastic packaging embodied emissions (PE/LDPE/HDPE): typical values ~2.0–2.6 kg CO₂e per kg plastic (we use 2.0 kg CO₂e/kg for a conservative estimate). ScienceDirect+1
Road freight emission factor (India) for heavy trucks / baseline fleets: ~0.33 kg CO₂ per tonne-km (Green Freight / Indian fleet studies baseline). Clean Air Asia+1
Context on spices, processing challenges & supply chain traits: review of Indian spices literature. PMC
NOTE: Where primary LCA data for “sabji masala” are lacking I used documented values for spice processing (grinding, drying), national grid EF, packaging LCA values and freight EF. I state assumptions explicitly below so you can substitute better local data if available.
Agriculture / raw spice production (field stage)
Lumped upstream (field) emissions (fertiliser use, field diesel, soil N₂O etc.) assumed: 2.0 kg CO₂e per kg finished spice mix (this is a conservative/representative crop-product value for mixed spice powders — see references/discussion). PMC+1
Processing (on-site at spice mill)
Grinding (size reduction): 0.309 kWh per kg (309 kWh/t). PMC
Drying (if required, energy to remove residual moisture): 1.0 kWh per kg (moderate assumption; pulsed/infrared and heat-pump approaches vary widely). ResearchGate+1
Electricity emission factor (India grid): 0.716 kg CO₂/kWh. Central Electricity Authority
Packaging
Primary packaging: single-layer polyethylene pouch 30 g plastic per kg product (0.03 kg plastic per kg product). Embodied emission assumed 2.0 kg CO₂e per kg plastic. ScienceDirect+1
Transport
Road transport (farm → mill → distribution): assume 50 km farm→mill + 200 km mill→distribution (total 250 km).
Road freight emission factor: 0.33 kg CO₂ per tonne-km. Clean Air Asia
Grinding emissions = 0.309 kWh/kg × 0.716 kgCO₂/kWh = 0.221 kg CO₂e/kg. PMC+1
Drying emissions = 1.0 kWh/kg × 0.716 kgCO₂/kWh = 0.716 kg CO₂e/kg. ResearchGate+1
Plastic mass × emission factor = 0.03 kg × 2.0 kgCO₂e/kg = 0.06 kg CO₂e/kg. ScienceDirect
Emission factor per tonne-km = 0.33 kg CO₂ / t-km. For 1 kg product: convert ton = 1000 kg
Road emissions = 0.33 (kgCO₂ / t-km) × (1/1000 tonnes) × 250 km = 0.33 × 0.001 × 250 = 0.0825 kg CO₂e/kg. Clean Air Asia
Farm stage (fertiliser, diesel, soil N₂O, land use aspects, pre-processing): 2.00 kg CO₂e/kg. PMC+1
Agriculture: 2.000 kg
Grinding: 0.221 kg
Drying: 0.716 kg
Packaging: 0.060 kg
Transport: 0.083 kg
TOTAL ≈ 3.08 kg CO₂e per kg sabji masala powder.
(Arithmetic: 2.000 + 0.221 + 0.716 + 0.060 + 0.0825 = 3.0797 ≈ 3.08 kg CO₂e/kg.)
The largest single uncertainties are the assumed farm-stage emissions (which depend on crop yields, fertilizer management, irrigation/water source, and whether spices are grown in monocrop or intercropped systems) and the drying method (sun drying ≪ energy-dried). If sun-dried, the drying electricity can drop to near-zero but with potential quality/safety tradeoffs. See sensitivity examples:
If farm emissions are 1.0 kgCO₂e/kg (very efficient/low-input smallholder supply), total ≈ 2.08 kg CO₂e/kg.
If drying uses a high-energy industrial dryer (2.5 kWh/kg) drying emissions = 2.5 × 0.716 = 1.79 kgCO₂e — total then ≈ 4.14 kg CO₂e/kg.
Packaging choice matters: switching to recycled polyethylene or a lighter laminate reduces packaging emissions proportionally. Replacing plastic with a paper pouch raises questions of recyclability vs. embodied emissions and food moisture barrier — tradeoffs must be analyzed.
Water footprint: spices vary strongly; global crop water footprints are available and should be referenced when ingredient origin is known. Many spice crops have relatively lower blue-water use than major cereals but can still be significant regionally. waterfootprint.org
Agrochemical risks: pesticide residues and intensive fertilizer use increase environmental and human-health risks; spice crops in India have documented pest management challenges (see spices review). PMC
Food safety & post-harvest losses: drying and storage control (moisture, mould, aflatoxin) strongly influence both quality and waste (waste increases per-kg footprint). Technical interventions at drying and storage reduce losses and GHG per kg delivered. niftem-t.ac.in
Avoid energy-intensive drying when possible: where climate allows, use hygienic solar tunnel drying or low-energy heat-pump dryers. This can cut drying electricity from ~1 kWh/kg to ≈0 or to a fraction. ResearchGate+1
Improve grinding energy efficiency: choose energy-efficient mills, optimize feed size and grinding schedule, and perform maintenance (reduces kWh/t). PMC
Switch to renewable electricity at the mill (onsite solar or green-tariff): at 0 kgCO₂/kWh grid-offset, processing emissions drop dramatically. Central Electricity Authority
Reduce & optimize packaging: lighter pouches, PCR (post-consumer recycled) polyethylene, or recyclable mono-material laminates. Conduct packaging LCA to avoid regrettable substitutions. ScienceDirect
Logistics optimization: consolidate loads, use rail for long distances where feasible (rail ≪ road per t-km), and optimize last-mile routing. Rail has much lower t-km emissions. IPCC+1
Agronomic measures: precision fertilizer application, organic amendments, integrated pest management, and improved yields per ha reduce per-kg farm emissions. Use soil testing and slow-release fertilisers where applicable. IPCC NGGI Portal+1
To convert this estimate into a full, defensible LCA / product environmental footprint:
Collect actual farm data: fertilizer application rates (kg N/ha), yields (kg/ha) and irrigation type (blue water).
Measure real plant energy use (kWh consumed per kg produced for drying, grinding, packaging), and local grid EF or onsite renewable fraction.
Measure actual packaging mass and material composition and use supplier LCA data for the laminate.
Use a standard LCA tool or guidance (e.g., GHG Protocol / ISO 14040/44) to formalize boundaries, allocation, and ensure consistent GWP (e.g., GWP100 AR5 or AR4). GHG Protocol+1
CEA — CO₂ Baseline Database for the Indian Power Sector (User Guide) — Indian grid emission factor 0.716 tCO₂/MWh (≈ 0.716 kgCO₂/kWh). Central Electricity Authority
Benavides, P.T. et al., Life Cycle Greenhouse Gas Emissions and Energy Use of Plastics (review of plastic packaging emission intensities). ScienceDirect
Review: Indian spices: past, present and future challenges — overview of spice crops, processing and supply chain issues. PMC
IPCC guidance on N₂O emissions from agricultural soils — emission factors and method background for estimating soil N₂O. IPCC NGGI Portal+1
Grinding / size-reduction energy studies (examples showing ~309 kWh/t = 0.309 kWh/kg for fine milling/powders). PMC
Drying energy studies (infrared / hot-air drying for spices/turmeric; reported specific energies range widely — cited values used to select a moderate 1.0 kWh/kg assumption). ResearchGate+1
Green Freight / Clean Freight studies (India fleet baseline: ~0.33 kg CO₂ / tonne-km for some truck baselines; and methodologies for freight GHG calculation). Clean Air Asia+1
A representative, transparent estimate yields ~3.08 kg CO₂e per kg Sabji Masala powder (cradle to distribution) under the assumptions listed. Central Electricity Authority+1
Greatest leverage to reduce this footprint: lower farm inputs & losses (reduce upstream emissions), use low-energy or solar drying, shift to renewable electricity at the mill, and optimize packaging & logistics. ResearchGate+2ScienceDirect+2
No offers available for this product at the moment.
Contact the vendor for bulk order pricing: Hiren Chheda
Please contact the vendor directly for their specific return and shipping policies.
For any inquiries, contact us at info@cleantech-mart.com