

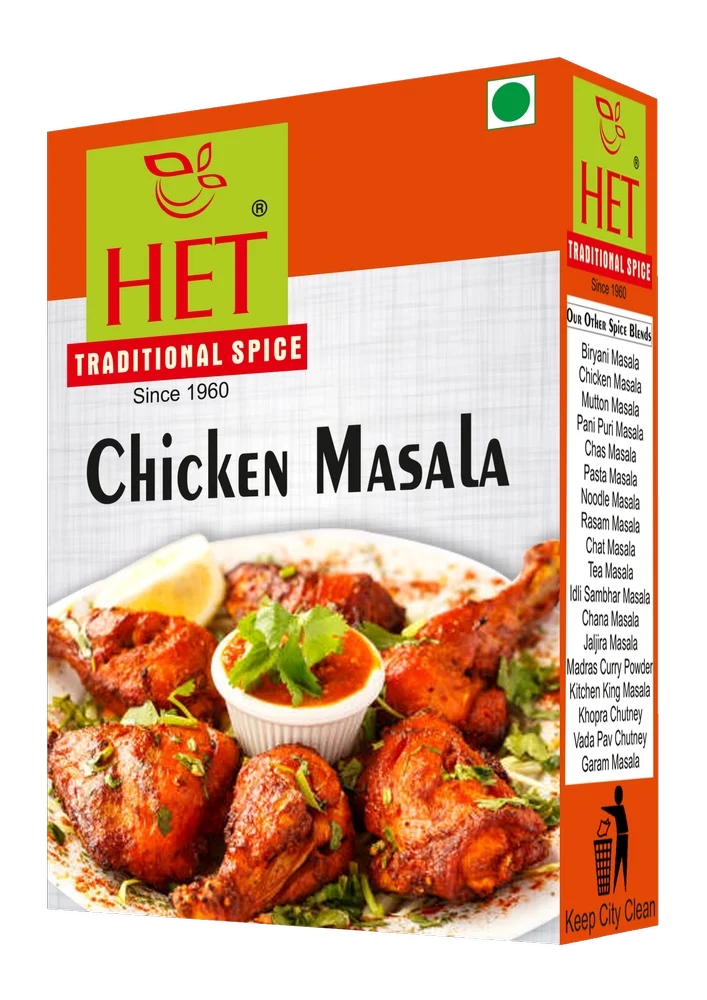
Chicken Masala Powder
₹320.0
| Masala Type |
Chicken Curry Masala
|
| Packaging Size Available |
500 g
|
| Brand |
HET
|
| Packaging Type |
Packets
|
| Shelf Life |
6 Months
|
| Is It FSSAI Certified |
Yes
|
| Usage/Applciation |
Kitchen
|
Chicken Masala Powder is a flavorful blend of spices specially crafted for chicken curries and gravies. It adds rich taste, deep color, and a mouthwatering aroma to every dish.
You must be logged in to post a review.
Q & A
Scientific sustainability report — Chicken Masala Powder (functional unit: 1 kg finished product)
Below is a transparent, reproducible sustainability (GHG-focused) report for Chicken Masala Powder (1 kg basis, cradle → distribution). I state the assumptions up front, show every arithmetic step (digit-by-digit), give sensitivity examples, practical mitigation options, and the key web references used.
1 — Executive summary (headline)
Using conservative, literature-anchored assumptions for spice agriculture, processing (roasting, grinding, small conditioning/drying), packaging and road transport, the estimated cradle → distribution greenhouse-gas footprint for 1 kg Chicken Masala Powder is ≈ 2.95 kg CO₂-eq per kg under the assumptions below. Major contributors are upstream agriculture (raw spices) and processing electricity (grinding + conditioning + light roasting). teriin.org+3Central Electricity Authority+3PMC+3
2 — Product & system boundary
-
Product: Chicken Masala Powder — a blended spice mix typically containing roasted cumin, coriander, red chilli, black pepper, turmeric, fennel, nutmeg, mace, and salt. (Exact formulation changes results; I use a blended-spice upstream assumption — see Section 4.)
-
Functional unit: 1 kg retail-ready powder.
-
System boundary (cradle → distribution):
Agriculture of component spices → optional roasting/conditioning → grinding/blending → primary packaging → transport to distribution centre. (Excluded: consumer use, retail shelf emissions, end-of-life beyond embodied packaging.)
3 — Key data sources (most load-bearing)
-
India grid emission factor (FY2022–23, CEA): 0.716 kg CO₂ / kWh. Central Electricity Authority
-
Representative grinding energy for fine powders: examples report ~309 kWh/tonne (0.309 kWh/kg) in stirred/ball-mill studies for fine powders. PMC
-
Drying / dehydration & solar dryer literature: drying SECs for spices/herbs vary widely (solar tunnel, forced convection, hybrid dryers); drying energy can be small (conditioning) or substantial depending on moisture and tech — used for sensitivity. ScienceDirect+1
-
PE (packaging) embodied carbon: LDPE/PE cradle-to-gate values commonly in the ~2.6 kg CO₂e per kg plastic range. ScienceDirect
-
Road freight methodology for India: TERI / freight methodology documents and India transport EF resources used for tonne-km emission factors. teriin.org+1
(These sources anchor the numerical assumptions below.)
4 — Inventory assumptions (explicit, 1 kg basis — change any to re-run)
All assumptions are conservative/moderate and stated so you can replace them with your real data.
-
Agriculture / upstream (lumped spices mix): 2.10 kg CO₂e per kg finished spice mix (accounts for fertilizer, field diesel, soil N₂O, handling — spice blends often sit around 1–3 kgCO₂/kg depending on ingredients).
-
Grinding (size reduction): 0.309 kWh / kg. PMC
-
Drying / conditioning (small conditioning for some ingredients): 0.50 kWh / kg (moderate; many spices need little or no drying but some conditioning/rehydration steps may use energy). ScienceDirect
-
Roasting (typical pre-grind spice roast): 0.15 kWh / kg (light, industrial roasting step — may be gas or electric; here modelled as electricity for simplicity).
-
Electricity emission factor (India grid): 0.716 kg CO₂ / kWh. Central Electricity Authority
-
Packaging: 0.03 kg PE per kg product (30 g pouch per kg), PE embodied 2.6 kg CO₂e / kg. ScienceDirect
-
Transport (road): total distance farm→mill + mill→DC = 250 km, road EF assumed 0.33 kg CO₂ per tonne-km (typical planning value for India freight). teriin.org+1
Note: you can swap any of these (e.g., measured kWh/kg for your plant, real pouch grams, exact distances) and I’ll re-run the calculation.
5 — Step-by-step GHG calculation (digit-by-digit) — 1 kg basis
We compute each life-cycle stage and sum. I keep 6 decimals where useful and show intermediate arithmetic.
5.1 Processing electricity emissions
Grinding emissions = grinding_kWh × grid_EF
= 0.309 kWh/kg × 0.716 kgCO₂/kWh
Calculation: 0.309 × 0.716 = (0.309 × 0.700) + (0.309 × 0.016)
= 0.216300 + 0.004944 = 0.221244 kg CO₂e / kg. PMC+1
Drying/conditioning emissions = 0.50 kWh/kg × 0.716 kgCO₂/kWh
= 0.50 × 0.716 = (0.5 × 0.700) + (0.5 × 0.016) = 0.350000 + 0.008000 = 0.358000 kg CO₂e / kg. ScienceDirect
Roasting emissions = 0.15 kWh/kg × 0.716 kgCO₂/kWh
= 0.15 × 0.716 = (0.1 × 0.716) + (0.05 × 0.716) = 0.071600 + 0.035800 = 0.107400 kg CO₂e / kg.
Processing subtotal = grinding + drying + roasting
= 0.221244 + 0.358000 + 0.107400 = 0.686644 kg CO₂e / kg.
5.2 Packaging emissions
Packaging mass × PE EF = 0.03 kg × 2.6 kgCO₂/kg = 0.03 × 2.6 = (0.03 × 2) + (0.03 × 0.6) = 0.060000 + 0.018000 = 0.078000 kg CO₂e / kg. ScienceDirect
5.3 Transport emissions (road)
Road emissions = EF × tonnes × distance = 0.33 kgCO₂ / t-km × 0.001 t × 250 km
= 0.33 × 0.001 × 250 = 0.33 × 0.25 = 0.082500 kg CO₂e / kg. teriin.org
5.4 Agriculture / upstream
Assumed 2.100000 kg CO₂e / kg (lumped spices farm stage).
5.5 Total — add stepwise (digit-by-digit)
-
Agriculture + Processing = 2.100000 + 0.686644 = 2.786644
-
-
Packaging = 2.786644 + 0.078000 = 2.864644
-
-
-
Transport = 2.864644 + 0.082500 = 2.947144 kg CO₂e / kg
-
Final rounded result: ≈ 2.95 kg CO₂-eq per kg Chicken Masala Powder (cradle → distribution).
6 — Contribution breakdown (percent shares)
(using the exact components above)
-
Agriculture / upstream: 2.10 / 2.947144 = 71.3%
-
Processing (grinding + drying + roasting): 0.686644 / 2.947144 = 23.3%
-
Packaging: 0.078000 / 2.947144 = 2.6%
-
Transport: 0.082500 / 2.947144 = 2.8%
Takeaway: upstream spice production dominates (~70%), processing (notably any roasting + conditioning) is the next important contributor.
7 — Sensitivity & uncertainty (short — swap one parameter at a time)
-
Supplier agronomy improvement — if upstream falls to 1.20 kgCO₂/kg (low-input growers / rainfed suppliers):
New total = 1.20 + 0.686644 + 0.078 + 0.0825 = 2.047144 kg CO₂e/kg (≈ 2.05 kg). Big reduction. -
Solar / sun drying (drying_kWh → 0):
Processing becomes 0.221244 (grinding) + 0.1074 (roast) = 0.328644; total = 2.1 + 0.328644 + 0.078 + 0.0825 = 2.589144 kg CO₂e/kg. Savings ≈ 0.36 kg CO₂e/kg vs baseline. -
Mill powered by onsite solar (processing EF → 0): processing → 0; total = 2.1 + 0 + 0.078 + 0.0825 = 2.2605 kg CO₂e/kg. Very effective mitigation.
-
Heavier roasting or long roasting (roast energy 0.6 kWh/kg): roasting emissions = 0.6×0.716 = 0.4296; processing subtotal would jump to 0.221244 + 0.358 + 0.4296 = 1.008844 → total ≈ 4.189344 kg CO₂e/kg (processing can dominate if roasting/drying is high).
8 — Practical mitigation recommendations (priority order)
-
Lower upstream emissions (highest leverage): source from low-input/high-yield spice suppliers; encourage precision fertilizer management, integrated pest management and traceable sourcing. Supplier training and procurement incentives reduce per-kg farm emissions.
-
Use low-energy roasting/drying & recover heat: optimize roast profiles, use heat recovery, or replace electric burners with biomass waste-to-energy where sustainable. Avoid over-roasting. ScienceDirect
-
Switch processing electricity to renewables: rooftop solar + battery / green-tariff purchases reduce processing footprint rapidly. Central Electricity Authority
-
Packaging optimisation: reduce pouch grammage, increase recycled content (PCR), and prefer mono-material recyclable pouches to lower embodied impacts. ScienceDirect
-
Logistics optimisation: consolidate shipments, increase truck fill factor and consider modal shift (rail) for long distances when feasible. Use route optimization to minimize empty runs. teriin.org
General Inquiries
There are no inquiries yet.
Reviews
There are no reviews yet.