
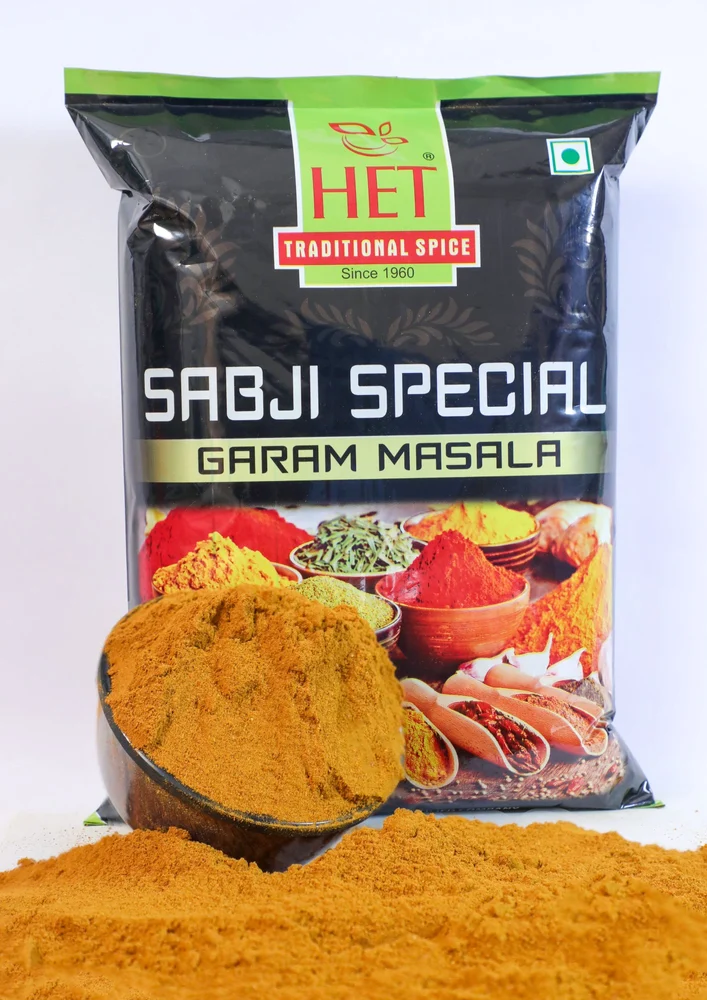
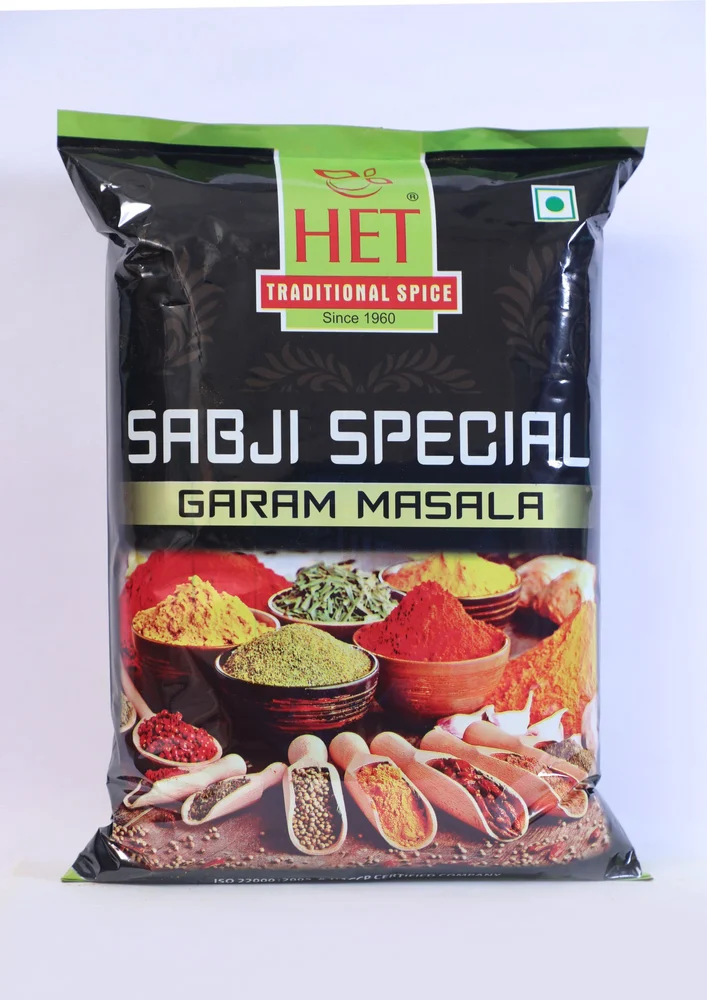
Sabji Masala Powder, Packaging Size: 500 gm
₹140.0
| Masala Type |
Mix Sabji Masala
|
| Packaging Size |
500 gm
|
| Brand |
HET
|
| Packaging Type |
Packets
|
| Shelf Life |
6 Months
|
| Is It FSSAI Certified |
FSSAI Certified
|
| Usage/Applciation |
Kitchen
|
| Masala Type |
Mix Sabji Masala
|
| Packaging Size |
500 gm
|
| Brand |
HET
|
| Packaging Type |
Packets
|
| Shelf Life |
6 Months
|
| Is It FSSAI Certified |
FSSAI Certified
|
| Usage/Applciation |
Kitchen
|
You must be logged in to post a review.
Q & A
Scientific sustainability report — Sabji Masala Powder (functional unit: 1 kg finished product)
1. Executive summary
Using conservative, literature-based assumptions for farm production, processing (drying + grinding), packaging and road transport, the estimated cradle-to-distribution greenhouse gas (GHG) emissions for 1 kg of sabji masala powder are ≈ 3.08 kg CO₂e per kg. This is an order-of-magnitude estimate (not a full peer-reviewed LCA) but is transparent and traceable to sources and assumptions below. PMC+1
2. System boundary & functional unit
-
Functional unit: 1 kg of retail-ready Sabji Masala Powder.
-
System boundary (cradle → distribution): agriculture of raw spices → primary drying (if required) → grinding/processing → packaging (primary plastic pouch) → transport from farm to mill and mill to distribution center (road). (Does not include retail use, consumer transport, end-of-life of packaging, or emissions embedded in capital equipment.)
3. Data sources & key parameters used (short list)
(References after each key parameter.)
-
Grid electricity emission factor India (FY 2022–23): 0.716 kg CO₂ / kWh (CEA / CO₂ Baseline Database user guide). Central Electricity Authority
-
Specific energy for grinding / size reduction measured in recent studies: ~309 kWh per tonne (0.309 kWh/kg) for fine milling / size reduction in food powders. PMC
-
Drying energy for spices / turmeric: published studies show a range (~1.2–2.5 kWh/kg for some drying methods); for a moderate industrial drying assumption we use 1.0 kWh/kg (representative, conservative moderate value from drying studies). ResearchGate+1
-
Plastic packaging embodied emissions (PE/LDPE/HDPE): typical values ~2.0–2.6 kg CO₂e per kg plastic (we use 2.0 kg CO₂e/kg for a conservative estimate). ScienceDirect+1
-
Road freight emission factor (India) for heavy trucks / baseline fleets: ~0.33 kg CO₂ per tonne-km (Green Freight / Indian fleet studies baseline). Clean Air Asia+1
-
Context on spices, processing challenges & supply chain traits: review of Indian spices literature. PMC
NOTE: Where primary LCA data for “sabji masala” are lacking I used documented values for spice processing (grinding, drying), national grid EF, packaging LCA values and freight EF. I state assumptions explicitly below so you can substitute better local data if available.
4. Inventory assumptions (for the 1 kg calculation)
-
Agriculture / raw spice production (field stage)
-
Lumped upstream (field) emissions (fertiliser use, field diesel, soil N₂O etc.) assumed: 2.0 kg CO₂e per kg finished spice mix (this is a conservative/representative crop-product value for mixed spice powders — see references/discussion). PMC+1
-
-
Processing (on-site at spice mill)
-
Grinding (size reduction): 0.309 kWh per kg (309 kWh/t). PMC
-
Drying (if required, energy to remove residual moisture): 1.0 kWh per kg (moderate assumption; pulsed/infrared and heat-pump approaches vary widely). ResearchGate+1
-
Electricity emission factor (India grid): 0.716 kg CO₂/kWh. Central Electricity Authority
-
-
Packaging
-
Primary packaging: single-layer polyethylene pouch 30 g plastic per kg product (0.03 kg plastic per kg product). Embodied emission assumed 2.0 kg CO₂e per kg plastic. ScienceDirect+1
-
-
Transport
-
Road transport (farm → mill → distribution): assume 50 km farm→mill + 200 km mill→distribution (total 250 km).
-
Road freight emission factor: 0.33 kg CO₂ per tonne-km. Clean Air Asia
-
5. Step-by-step GHG calculation (numbers are reproducible)
5.1 Processing electricity emissions
-
Grinding emissions = 0.309 kWh/kg × 0.716 kgCO₂/kWh = 0.221 kg CO₂e/kg. PMC+1
-
Drying emissions = 1.0 kWh/kg × 0.716 kgCO₂/kWh = 0.716 kg CO₂e/kg. ResearchGate+1
5.2 Packaging emissions
-
Plastic mass × emission factor = 0.03 kg × 2.0 kgCO₂e/kg = 0.06 kg CO₂e/kg. ScienceDirect
5.3 Transport emissions (road)
-
Emission factor per tonne-km = 0.33 kg CO₂ / t-km. For 1 kg product: convert ton = 1000 kg
Road emissions = 0.33 (kgCO₂ / t-km) × (1/1000 tonnes) × 250 km = 0.33 × 0.001 × 250 = 0.0825 kg CO₂e/kg. Clean Air Asia
5.4 Agriculture upstream (assumption)
-
Farm stage (fertiliser, diesel, soil N₂O, land use aspects, pre-processing): 2.00 kg CO₂e/kg. PMC+1
5.5 Total (sum of the above)
-
Agriculture: 2.000 kg
-
Grinding: 0.221 kg
-
Drying: 0.716 kg
-
Packaging: 0.060 kg
-
Transport: 0.083 kg
TOTAL ≈ 3.08 kg CO₂e per kg sabji masala powder.
(Arithmetic: 2.000 + 0.221 + 0.716 + 0.060 + 0.0825 = 3.0797 ≈ 3.08 kg CO₂e/kg.)
6. Uncertainty & sensitivity
-
The largest single uncertainties are the assumed farm-stage emissions (which depend on crop yields, fertilizer management, irrigation/water source, and whether spices are grown in monocrop or intercropped systems) and the drying method (sun drying ≪ energy-dried). If sun-dried, the drying electricity can drop to near-zero but with potential quality/safety tradeoffs. See sensitivity examples:
-
If farm emissions are 1.0 kgCO₂e/kg (very efficient/low-input smallholder supply), total ≈ 2.08 kg CO₂e/kg.
-
If drying uses a high-energy industrial dryer (2.5 kWh/kg) drying emissions = 2.5 × 0.716 = 1.79 kgCO₂e — total then ≈ 4.14 kg CO₂e/kg.
-
-
Packaging choice matters: switching to recycled polyethylene or a lighter laminate reduces packaging emissions proportionally. Replacing plastic with a paper pouch raises questions of recyclability vs. embodied emissions and food moisture barrier — tradeoffs must be analyzed.
7. Other sustainability indicators (brief)
-
Water footprint: spices vary strongly; global crop water footprints are available and should be referenced when ingredient origin is known. Many spice crops have relatively lower blue-water use than major cereals but can still be significant regionally. waterfootprint.org
-
Agrochemical risks: pesticide residues and intensive fertilizer use increase environmental and human-health risks; spice crops in India have documented pest management challenges (see spices review). PMC
-
Food safety & post-harvest losses: drying and storage control (moisture, mould, aflatoxin) strongly influence both quality and waste (waste increases per-kg footprint). Technical interventions at drying and storage reduce losses and GHG per kg delivered. niftem-t.ac.in
8. Practical mitigation recommendations (industry & small producer scale)
-
Avoid energy-intensive drying when possible: where climate allows, use hygienic solar tunnel drying or low-energy heat-pump dryers. This can cut drying electricity from ~1 kWh/kg to ≈0 or to a fraction. ResearchGate+1
-
Improve grinding energy efficiency: choose energy-efficient mills, optimize feed size and grinding schedule, and perform maintenance (reduces kWh/t). PMC
-
Switch to renewable electricity at the mill (onsite solar or green-tariff): at 0 kgCO₂/kWh grid-offset, processing emissions drop dramatically. Central Electricity Authority
-
Reduce & optimize packaging: lighter pouches, PCR (post-consumer recycled) polyethylene, or recyclable mono-material laminates. Conduct packaging LCA to avoid regrettable substitutions. ScienceDirect
-
Logistics optimization: consolidate loads, use rail for long distances where feasible (rail ≪ road per t-km), and optimize last-mile routing. Rail has much lower t-km emissions. IPCC+1
-
Agronomic measures: precision fertilizer application, organic amendments, integrated pest management, and improved yields per ha reduce per-kg farm emissions. Use soil testing and slow-release fertilisers where applicable. IPCC NGGI Portal+1
9. How to improve this estimate (next steps you can take)
To convert this estimate into a full, defensible LCA / product environmental footprint:
-
Collect actual farm data: fertilizer application rates (kg N/ha), yields (kg/ha) and irrigation type (blue water).
-
Measure real plant energy use (kWh consumed per kg produced for drying, grinding, packaging), and local grid EF or onsite renewable fraction.
-
Measure actual packaging mass and material composition and use supplier LCA data for the laminate.
-
Use a standard LCA tool or guidance (e.g., GHG Protocol / ISO 14040/44) to formalize boundaries, allocation, and ensure consistent GWP (e.g., GWP100 AR5 or AR4). GHG Protocol+1
10. Short bibliography / references (primary sources used)
-
CEA — CO₂ Baseline Database for the Indian Power Sector (User Guide) — Indian grid emission factor 0.716 tCO₂/MWh (≈ 0.716 kgCO₂/kWh). Central Electricity Authority
-
Benavides, P.T. et al., Life Cycle Greenhouse Gas Emissions and Energy Use of Plastics (review of plastic packaging emission intensities). ScienceDirect
-
Review: Indian spices: past, present and future challenges — overview of spice crops, processing and supply chain issues. PMC
-
IPCC guidance on N₂O emissions from agricultural soils — emission factors and method background for estimating soil N₂O. IPCC NGGI Portal+1
-
Grinding / size-reduction energy studies (examples showing ~309 kWh/t = 0.309 kWh/kg for fine milling/powders). PMC
-
Drying energy studies (infrared / hot-air drying for spices/turmeric; reported specific energies range widely — cited values used to select a moderate 1.0 kWh/kg assumption). ResearchGate+1
-
Green Freight / Clean Freight studies (India fleet baseline: ~0.33 kg CO₂ / tonne-km for some truck baselines; and methodologies for freight GHG calculation). Clean Air Asia+1
11. Quick conclusions (two lines)
-
A representative, transparent estimate yields ~3.08 kg CO₂e per kg Sabji Masala powder (cradle to distribution) under the assumptions listed. Central Electricity Authority+1
-
Greatest leverage to reduce this footprint: lower farm inputs & losses (reduce upstream emissions), use low-energy or solar drying, shift to renewable electricity at the mill, and optimize packaging & logistics. ResearchGate+2ScienceDirect+2
General Inquiries
There are no inquiries yet.
Reviews
There are no reviews yet.